USERGUIDE - INTERFACE
Getting started with the new Bilstatistik.dk
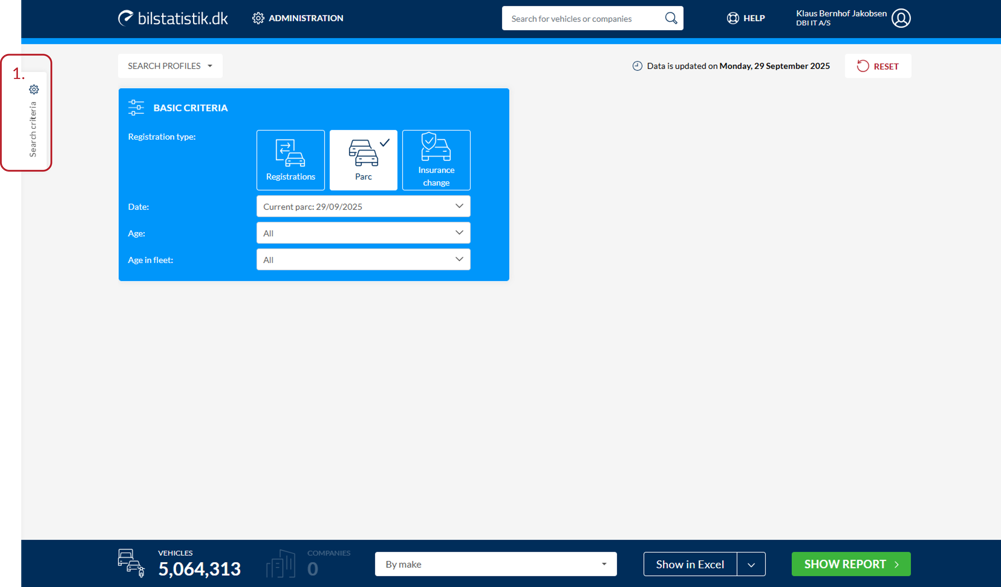
Search criteria
The display of search criteria is dynamic, and you can decide which search criteria you see and in what order they are displayed.
It is of course possible to change this on an ongoing basis if your needs change.
To begin with, your search page is completely blank.
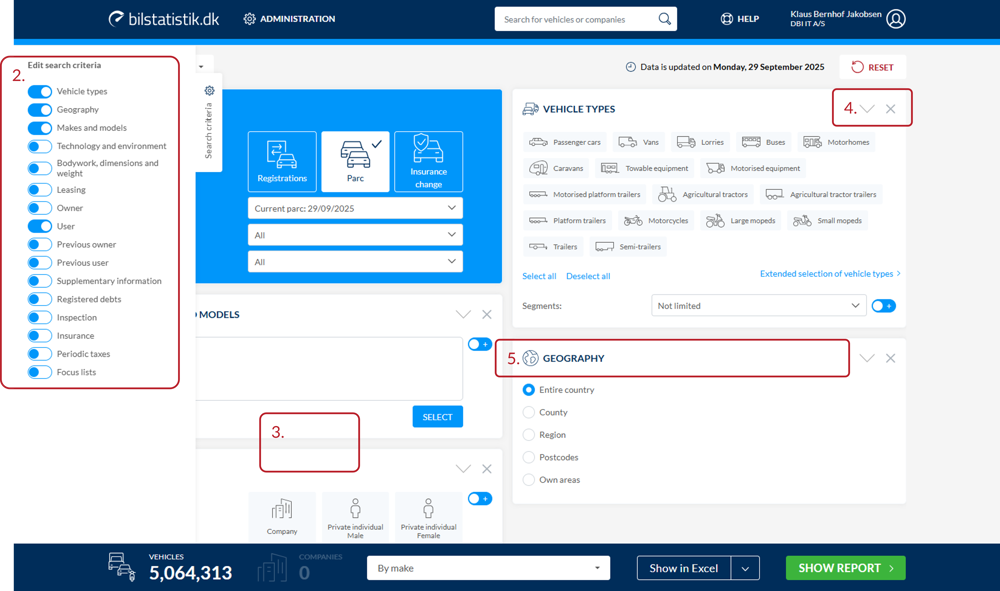
Customizing the search criteria
2. Turn the available search criteria on and off
3. The panel closes automatically when you click somewhere else on the screen.
4. You can easily close or minimize a panel.
5. You can drag a panel to another position to change the order of the open panels.
The interface
6. Registrations, Inventory and Insurance Changes have been moved from separate tabs to one combined selection under “Basic Criteria”
7. Vehicle type selection is made via the available vehicle icons. You can still switch to “Extended selection of vehicle types”. Note that the “Segments” selection is embedded in the vehicle types panel.
8. Search profiles have been moved to the top of the criteria page.
9. The button to reset the criteria page is now in the upper right corner of the criteria page.
10. Vehicle counter, company counter, report layout selection and button to export and view report have now been moved down to the bottom of the page, to create a more harmonious process.
11. Searching for individual vehicles and companies has been moved from separate tabs to one combined search field that can always be accessed from the top of the page.

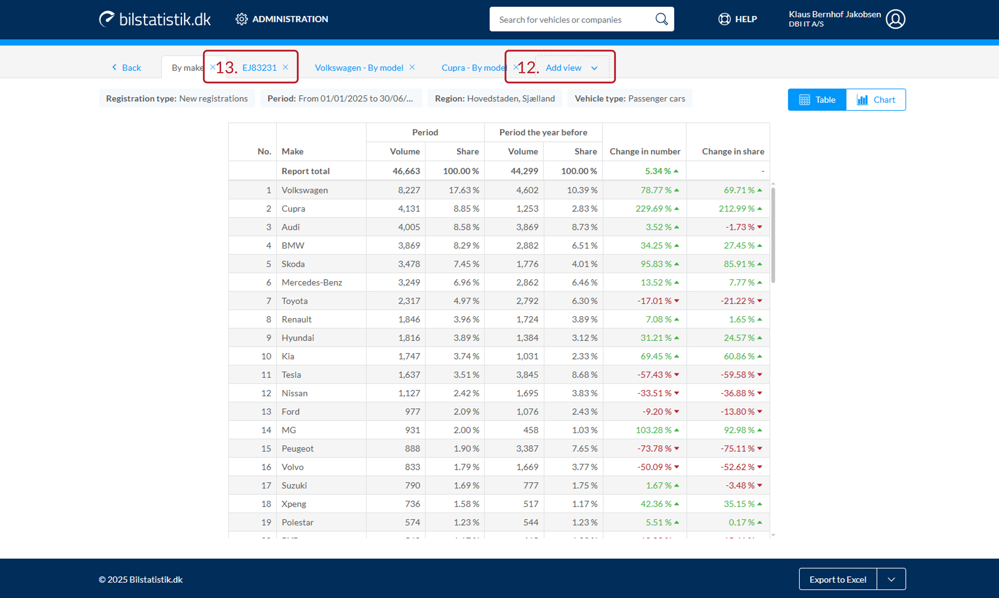
Report views
12. Once you have run a report, it is possible to add a new “view”.
This will correspond to previously changing the report layout of the run report, but now an extra tab will be added instead, with the new report.
Note that a new view is always based on the data the current view consists of.
This will allow you to create numerous parallel reports.
Only when you click “Back”, the reports will be closed.
13. Searched vehicle and company reports are arranged as tabs along the views. This allows you to have several reports open at the same time.
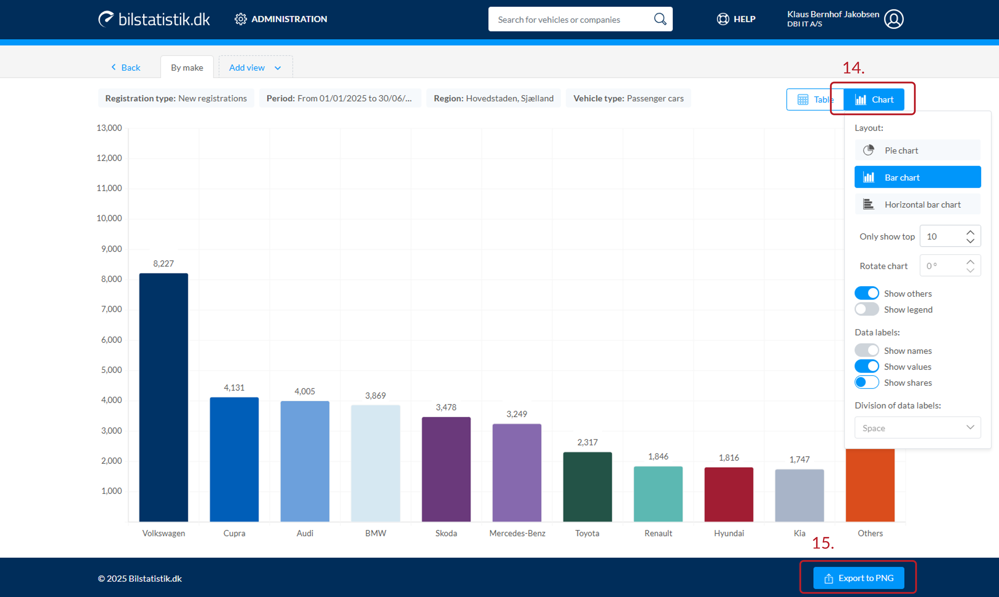
Charts
14. If supported by the format of the report being run, it will be possible to present the report in chart form.
Via the “Chart” button, settings will also appear for how the chart should look.
15. It is possible to save the chart as an image (in PNG format).